Please peruse the selection of web apps below. In addition to these public facing web apps, I have developed several internal facing web applications to help with data QAQC and analysis and find them to be valuable tools for communication and decision making.
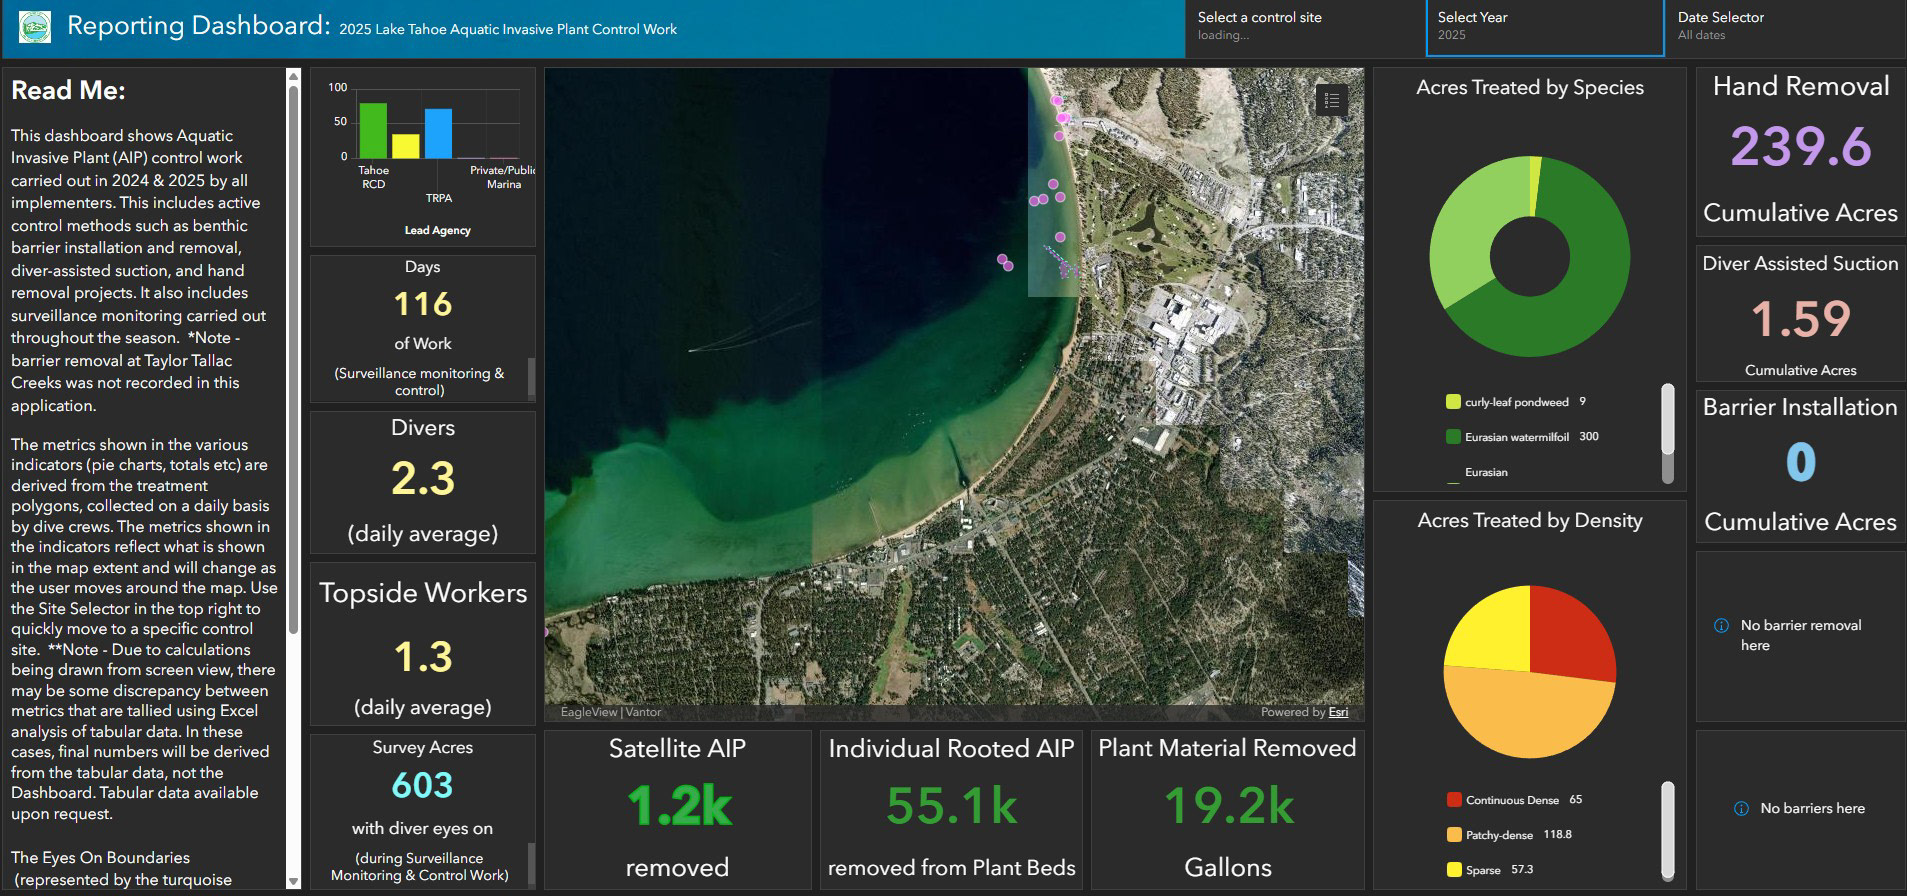
I created this dashboard using ArcGIS Dashboard web application to share aquatic invasive plant (AIP) control work with regulatory and funding agencies to fulfil annual reporting requirements. This created key efficiencies in reporting while also allowing a more comprehensive understanding of the effort and resulting AIP removed each year. This dashboard also serves as a reference tool for partner implementing agencies.
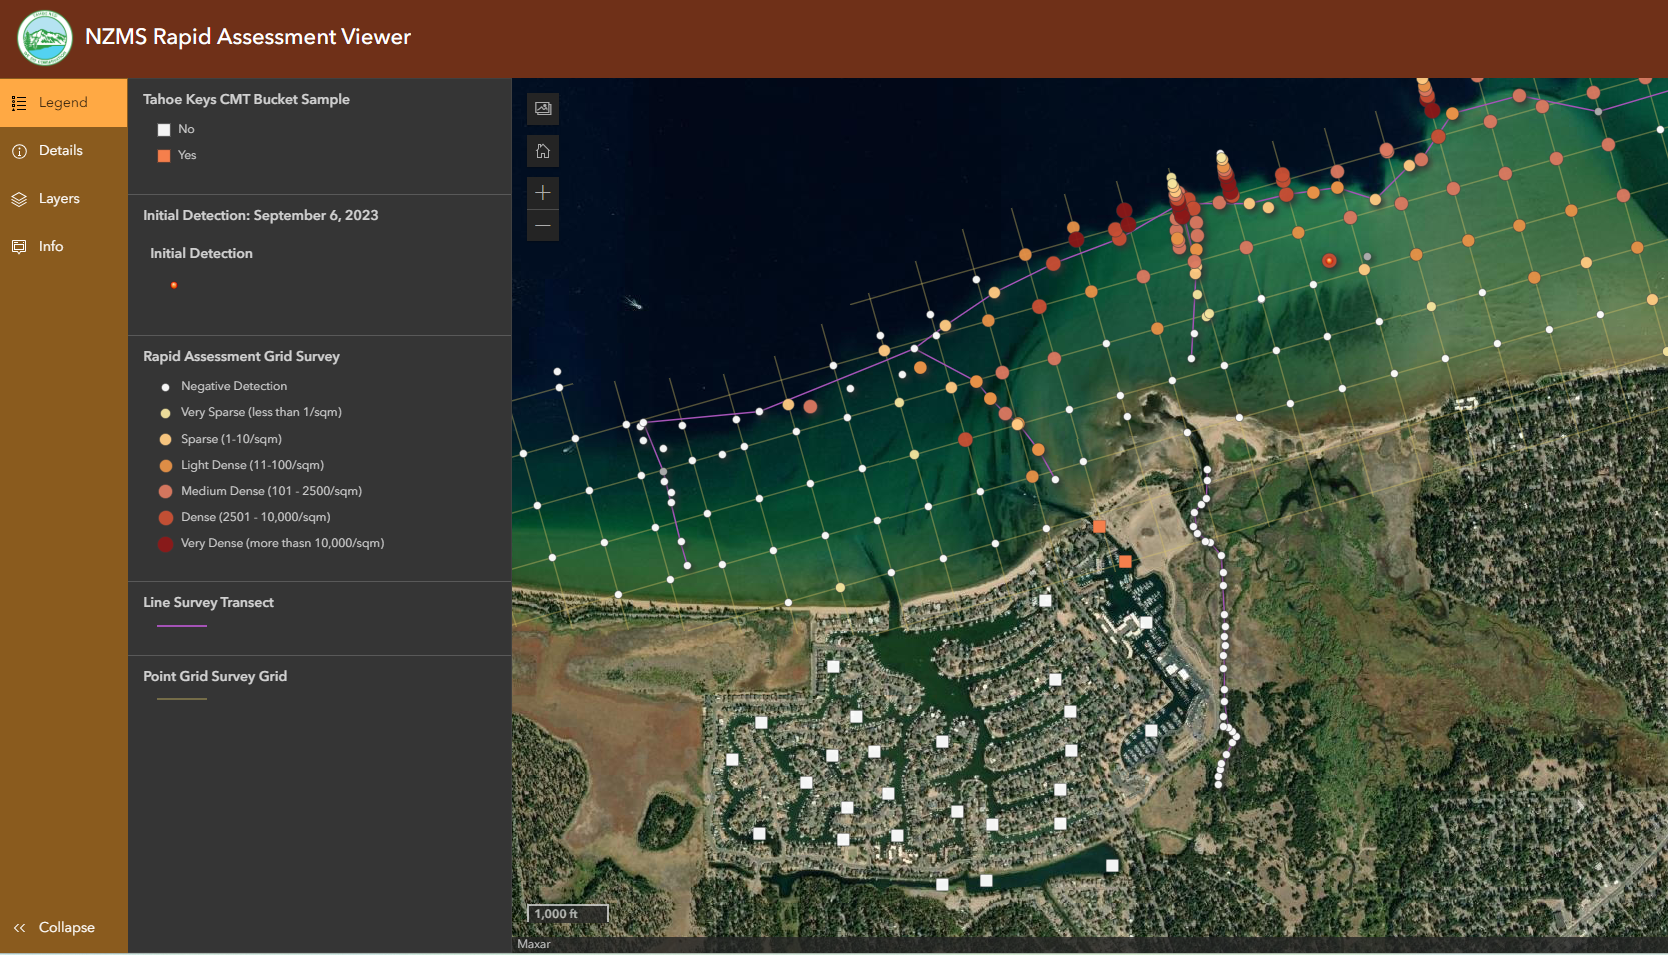
New Zealand Mudsnail Rapid Assessment Viewer
I created this webapp using ArcGIS Online and ArcGIS web applications. For this project, I rapidly created and deployed a Field Maps application for divers to use to collect data for the Grid Point Survey to assess distribution of New Zealand mudsnails. Initially, I created this web application for the Lake Tahoe New Zealand mudsnail Incident Team to review data as it was synced each night. Since this time, the web application has been updated to include additional survey data related to New Zealand mudsnails and be accessible to share with the Technical Advisory Committee and interested partner agencies.
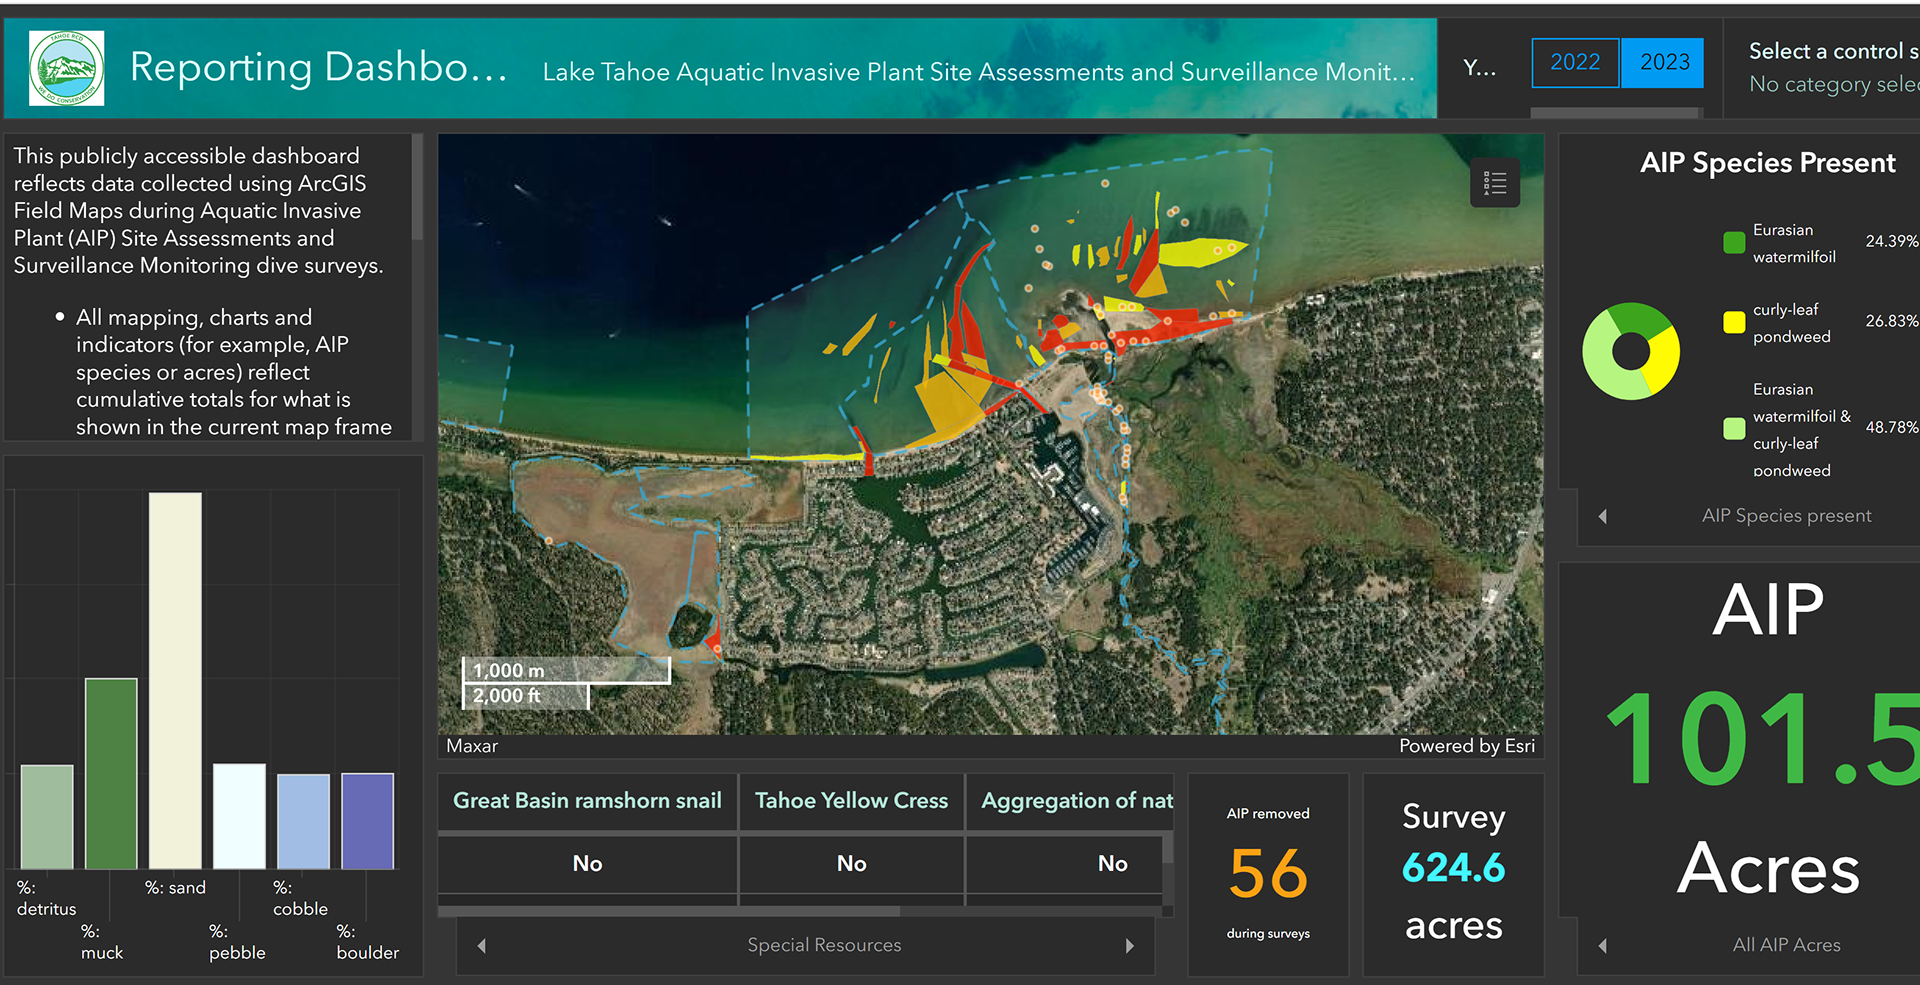
I created this dashboard using ArcGIS Dashboard web application to share the results of aquatic invasive plant dive surveys with regulatory and funding agencies to meet reporting requirements. I developed and standardized our program-wide survey protocols to incorporate the differences between sparse, patchy-dense, and dense aquatic invasive plant infestations in order to better track progress and develop treatment budgets.
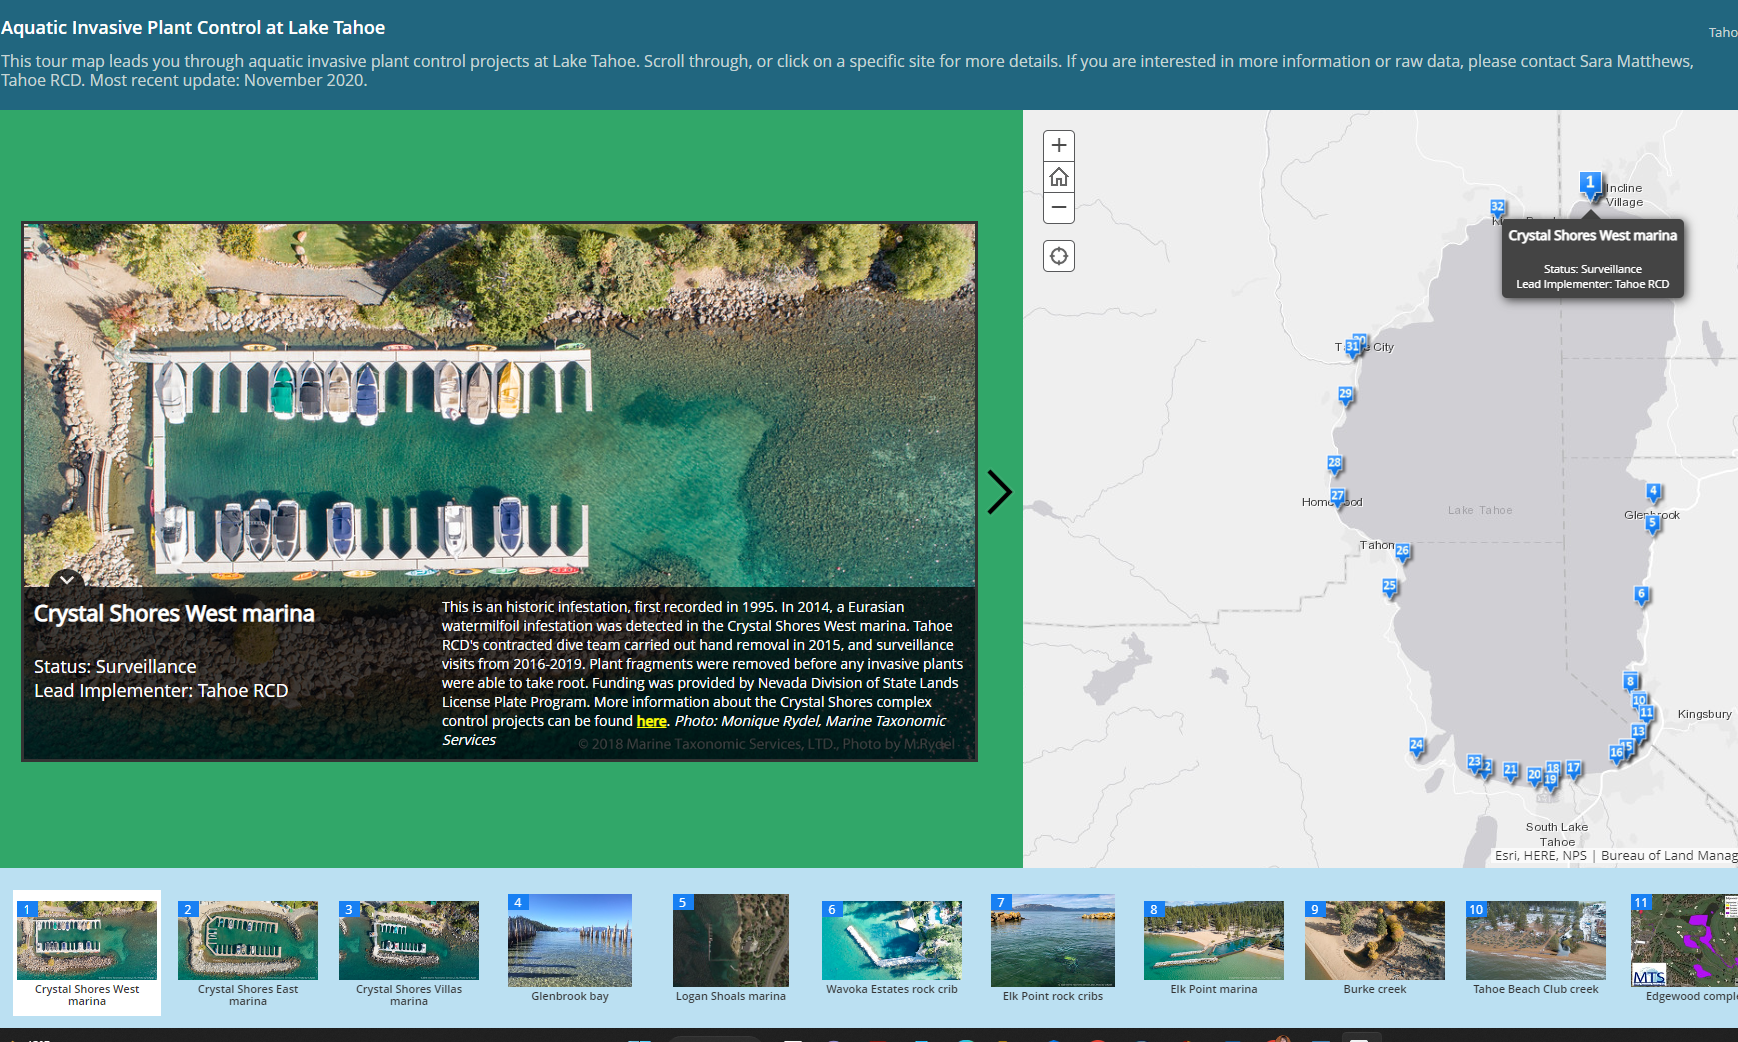
Aquatic Invasive Plant Control at Lake Tahoe web tour
I created this web tour using ArcGIS Story Maps for the Tahoe RCD AIS Control webpage. By clicking on Control Site locations on the map or in the bottom bar, users can self-guide to learn about specific locations or get a broad understanding of AIS Control work taking place around Lake Tahoe.
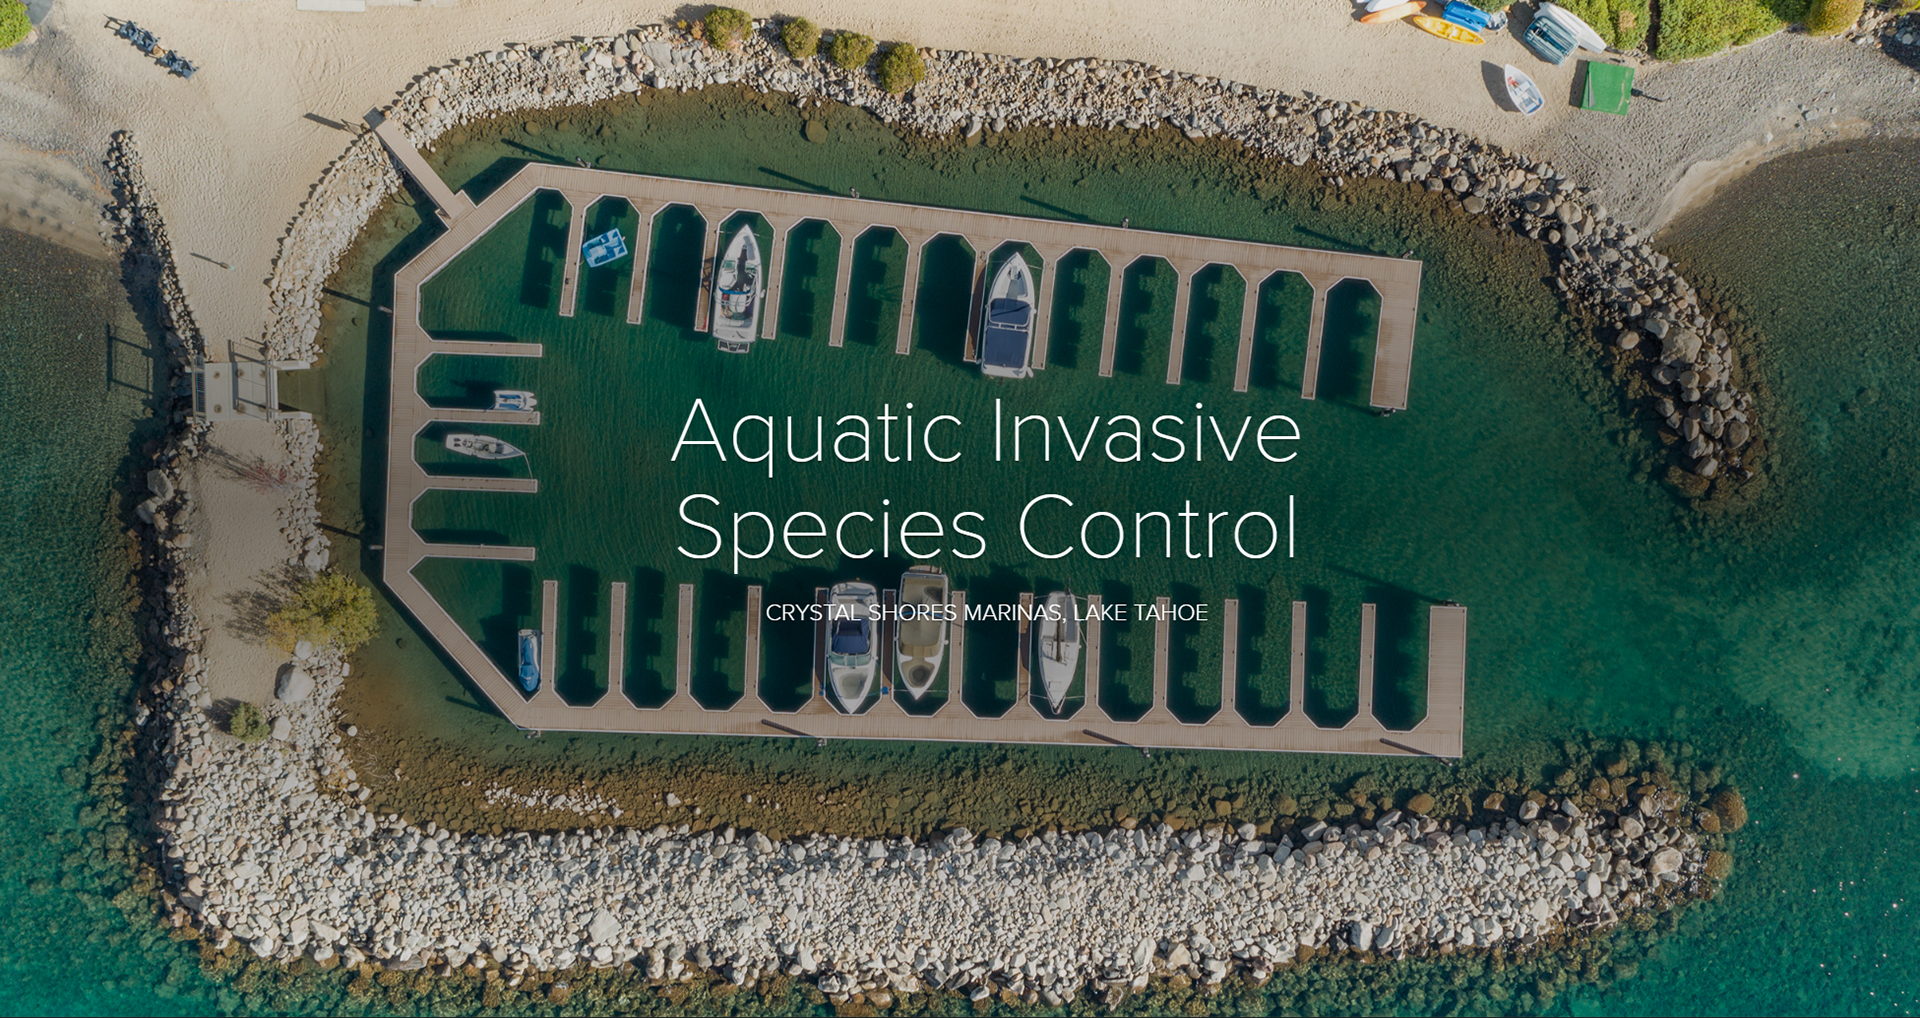
Aquatic Invasive Species Control: Crystal Shores Marinas web story
I created this web story using Adobe Spark to educate stakeholders about the success and methods used to control the aquatic invasive plant infestations at the Crystal Shores marinas complex.